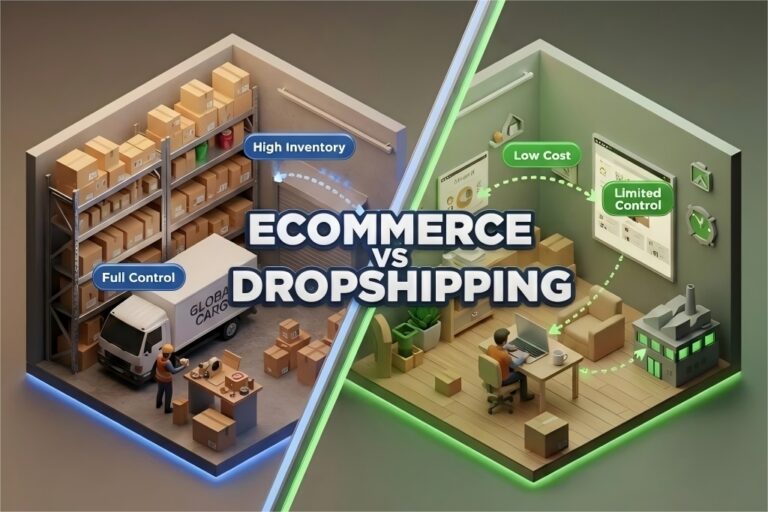



Ecommerce keeps expanding faster than almost any other retail channel, and dropshipping remains one of the most talked-about (and misunderstood) ways to sell online. Below is a data-driven snapshot of where the industry stands in 2026 — covering market size, social and mobile commerce, AI adoption, marketplaces, consumer behavior, and the real numbers behind dropshipping profitability.
A note on the numbers: a few stats below come from different surveys with different methodologies, so they won’t always line up perfectly — we’ve flagged the couple of spots where that matters.
Ecommerce Market Overview
- Global ecommerce revenue is expected to reach US$3.88 trillion in 2026, with the U.S. accounting for US$1.22 trillion of that total (Statista Market Insights).
- The global market is forecast to grow at a 6.84% CAGR between 2026 and 2030 (Statista Market Insights).
- The number of online shoppers worldwide is projected to hit 4.1 billion by 2030 (Statista Market Insights).
- Global ecommerce user penetration currently stands at 54.30% (2026, Statista Market Insights).
Global Dropshipping Market
- The global dropshipping market is valued at US$583.5 billion in 2026 (Grand View Research).
- It’s forecast to grow at a 20.70% CAGR through 2033 (Grand View Research).
- Asia Pacific holds the largest regional share at 36.00%, just ahead of North America’s 32.40% (2025, Grand View Research).
- The top 5 players — Alibaba, Shopify, Amazon, Printful, and Zendrop — together control only 13.90% of the market, a sign of how fragmented dropshipping still is (2025, Global Market Insights).
- Fashion is the largest product category, holding 37.4% market share (2025, Grand View Research).
- Food & Personal Care is the fastest-growing category, expanding at a 23.6% CAGR through 2033 (Grand View Research).
- The U.S. dropshipping market itself is forecast to grow at an 18.90% CAGR through 2033 (Grand View Research).
Dropshipping Success & Profitability
- Around 90% of dropshipping stores fail or are abandoned within their first few months (2026, Branvas).
- Only 10%–20% of stores ever reach recurring profitability (2026, TrueProfit).
- The average dropshipping store earns a 68% gross profit margin, but that shrinks to just 17% net once ads, platform fees, and returns are factored in (2026, TrueProfit).
- Just 2%–3% of dropshippers earn over US$500,000 in annual net profit (2026, TrueProfit).
- A new dropshipping business typically needs US$5,000–US$10,000 to get started (2026, TrueProfit).
Profit and ad spend both scale sharply with experience:
| Experience Level | Typical Monthly Net Profit | Typical Monthly Ad Spend |
|---|---|---|
| Beginner | US$200 – US$1,000 | US$200 – US$1,000+ |
| Intermediate | US$2,000 – US$10,000 | US$5,000 – US$15,000 |
| Experienced | Over US$10,000 | Over US$30,000 |
(2026, TrueProfit)
Worth noting: the top 2%–3% earning over US$500,000 a year sit well above even this “experienced” range — a reminder that outcomes are heavily skewed toward a small slice of sellers rather than following a smooth curve.
Social Commerce Statistics
- The global social commerce market is worth an estimated US$1.93 trillion in 2026 and is growing at a 37.40% CAGR through 2033 (Grand View Research).
- B2C sales make up 60.30% of that market (2025, Grand View Research).
- Video commerce is the largest social commerce sales channel, and personal & beauty care is the largest product category (2025, Grand View Research).
- Asia Pacific is by far the largest social commerce region, with a 72.3% share, and China is the largest single market within it (2025, Grand View Research).
- The U.S. social commerce market is forecast to grow at a 33.40% CAGR through 2033 (Grand View Research).
- 45% of shoppers globally now buy through social commerce channels (2026, DHL).
- There are 5.2 billion social media users worldwide, representing 64% global penetration (2026, SellersCommerce).
- The average user spends 143–151 minutes on social media each day, across 6.8 different platforms a month (2026, SellersCommerce).
- In the U.S., 117.1 million people — 33.50% of the population — now buy through social media (2026, SellersCommerce).
Mobile Commerce Statistics
- The global mobile commerce market is estimated at US$2.42 trillion in 2026, with the U.S. accounting for US$410 billion of that (Fortune Business Insights).
- 4.7 billion people, or 58% of the world’s population, had mobile internet access in 2025 (Grand View Research).
- An estimated 1.65 billion people are expected to shop via smartphone in 2026 (Dataopedia).
Cross-Border Ecommerce
- 70% of shoppers now purchase internationally, up 10 percentage points from 2025 (2026, DHL).
- 45% of shoppers cross borders more than once a month, and over 30% of all online orders now ship internationally (2026, DHL).
- Still, only 25% of businesses say they’re prioritizing cross-border delivery capabilities over the next 12 months (2026, DHL).
- Baby Boomers are a study in contrasts: 69% shop internationally for lower prices, yet 51% remain worried about fraud when they do (2026, DHL).
Marketplace Statistics
Amazon still dominates the marketplace landscape, but Walmart, Etsy, and Temu are each carving out their own lane:
| Marketplace | Metric | Value |
|---|---|---|
| Amazon | Global marketplace share | 37.60% |
| Amazon | Active sellers worldwide | 2.3 million |
| Amazon | Active customer accounts | 310+ million (2025) |
| Amazon | Third-party seller GMV | US$750 billion |
| Walmart | Third-party sellers | 150,000+ |
| Walmart | YoY marketplace growth | 32% |
| Etsy | Active buyers | 96 million (2025) |
| Etsy | Active sellers | 7.5 million (2025) |
| Etsy | Gross Merchandise Sales | US$14.8 billion (2025) |
| Temu | GMV growth | 142% YoY |
(2025–2026, Searchlab)
Shopping behavior on marketplaces follows a few clear patterns:
- 63% of product searches now begin on a marketplace rather than a search engine, and 56% start on Amazon specifically (2026, Searchlab).
- 67% of U.S. marketplace purchases are completed on a smartphone (2026, Searchlab).
- 89% of shoppers read reviews before their first purchase from a new seller (2026, Searchlab).
- 73% of brands now sell on both their own D2C site and third-party marketplaces (2026, Searchlab).
AI in Ecommerce
Market growth and retailer adoption
- The global AI-in-retail market is valued at US$20.0 billion in 2025 and is growing at a 29.90% CAGR (Research and Markets).
- Retailers that have adopted AI report real results: 69% saw higher annual revenue and 72% saw lower operating costs (2024, NVIDIA via Research and Markets).
- Over 60% of retailers plan to increase their AI investment within the next 18 months (2024, NVIDIA via Research and Markets).
- 84% of ecommerce businesses now rank AI as their top strategic priority, and 71% plan to hire dedicated AI staff within a year (2026, Sana Commerce via Triple Whale; Gorgias).
- Even so, 41.50% of ecommerce professionals still worry AI can’t fully resolve customer questions (2026, Gorgias).
Shopper-facing AI
- 38% of shoppers use AI-powered chat or virtual assistants, and 23% consider themselves “hands-free” AI users (2026, DHL).
- 64% of consumers use AI tools for product discovery or research, though 33% still don’t use them at all (2026, Salsify).
- Only 27% of consumers actually verify AI-generated shopping advice, and just 41% of Millennials say they trust AI recommendations (2026, Salsify).
- About 25% of consumers say they’ve used generative AI for shopping (2026, McKinsey).
AI’s impact on traffic and search
- Only 1–2% of brand-owned websites are actually cited by LLMs (2026, McKinsey).
- 44% of AI-search users now treat it as their primary search method (2025, McKinsey).
- AI-referred traffic to U.S. retail websites grew a striking 4,700% year-over-year, and those visitors spend 32% longer on site than average (2025, Adobe).
- Brands cited in Google’s AI Overviews see a 35% boost in click-through rates (2025, Yotpo).
Consumer Shopping Behavior
Price sensitivity and brand switching
- 39% of shoppers compare prices before buying, and 37% simply choose the lower-priced option (2026, Salsify).
- 65% say better prices are their main reason for shopping online, while 64% cite convenience (2026, Salsify).
- 72% of shoppers have switched to a new brand recently — rising to 80% among Millennials and 76% among Gen Z (2026, Salsify).
- 55% switched brands specifically for better prices or promotions, yet 68% say they’ll still pay more for a brand they trust (2026, Salsify).
Research, content, and personalization
- 52% of consumers research 2–3 channels before buying everyday products, rising to 54% for fashion and beauty but dropping to 39% for furniture (2026, Salsify).
- 61% of shoppers rely on high-quality product images or video, and 51% rely on detailed titles and descriptions (2026, Salsify).
- 37% say enhanced product content is genuinely helpful, while 30% are swayed by reviews and comparisons and 28% simply value better content overall (2026, Salsify).
- 37% say they’re encouraged by personalized recommendations, but only 25% would actually buy an AI-recommended product on the strength of a personalized explanation (2026, Salsify).
Sustainability and frugality
- More than 75% of consumers continue “trade-down” behaviors, and 82% are using products longer before replacing them (2026, McKinsey).
- 69% repair products instead of replacing them, and 68% say they’re actively reducing waste (2026, McKinsey).
- 30% buy secondhand apparel, and over 20% buy secondhand across other categories too (2026, McKinsey).
- Nearly 50% have started DIYing services they used to pay for (2026, McKinsey).
- Vacations remain consumers’ top splurge choice, and the travel experiences market grew 4.4% between 2023 and 2025 (McKinsey).
- Among Gen Z specifically, 12% say they’d rather splurge on at-home entertainment instead (2026, McKinsey).
Payments, search, and delivery habits
- The average shopper uses 4 different payment methods, and 41% say they specifically don’t want voice-enabled search (2026, DHL).
- Nearly 30% of shoppers now receive deliveries at out-of-home locations like lockers or pickup points (2026, DHL).
- 18% expect to buy more during seasonal holidays over the next five years (2026, DHL).
- 72% now expect next-day delivery as standard (2026, Searchlab).
Returns & Customer Expectations
- 67% of shoppers abandon their cart over delivery options, and 52% of businesses agree delivery is their single biggest cart-abandonment driver (2026, DHL).
- 70% won’t buy at all if they don’t trust the delivery/returns provider, and 70% abandon their cart when their preferred delivery or return option isn’t offered (2026, DHL).
- 35% abandon purchases when sustainability credentials are missing (2026, DHL).
- Over 60% of returns are now completed via out-of-home locations rather than home pickup (2026, DHL).
Sources: Grand View Research, Global Market Insights, Statista Market Insights, DHL E-Commerce Trends Report 2026, SellersCommerce, Fortune Business Insights, Dataopedia, Research and Markets, McKinsey, Salsify, Sana Commerce, Gorgias, Adobe, Yotpo, TrueProfit, Branvas, and Searchlab (Amazon, Walmart, Etsy, Temu and other marketplace data).
Several figures reflect forecasts or projections rather than current-year measurements, and a couple of stats (noted above) come from different survey populations — worth keeping in mind when comparing them directly.